This tech note describes commonly-used call quality measurement methods, explains the metrics in practical terms and describes acceptable voice quality levels for VoIP network services.
Introduction
Voice over IP systems can suffer from significant call quality and performance management problems. Network managers and others need to understand basic call quality measurement techniques, so that they can successfully monitor, manage and diagnose these problems.
This tech note describes commonly used call quality measurement methods, explains the metrics in practical terms and describes acceptable voice quality levels for VoIP networks.
Definition of Call Quality
IP call quality can be affected by noise, distortion, too high or low signal volume, echo, gaps in speech and a variety of other problems.
When measuring call quality, there are three basic categories that are studied:
Listening Quality -- Refers to how users rate what they "hear" during a call.
Conversational Quality -- Refers to how users rate the overall quality of a call based on listening quality and their ability to converse during a call. This includes any echo or delay related difficulties that may affect the conversation.
Transmission Quality -- Refers to the quality of the network connection used to carry the voice signal. This is a measure of network service quality as opposed to the specific call quality.
The objective of call quality measurement is to obtain a reliable estimate of one or more of the above categories using either subjective or objective testing methods i.e., using human test subjects or computer based measurement tools.
Listening Quality, Testing & MOS Scores
Subjective testing is the “time honored” method of measuring voice quality, but it is a costly and time consuming process. One of the better known subjective test methodologies is the Absolute Category Rating (ACR) Test.
In an ACR Test, a pool of listeners rate a series of audio files using a five-grade impairment scale ranging from 1 to 5:
5 -- Excellent
4 -- Good
3 -- Fair
2 -- Poor
1 -- Bad
After obtaining individual scores, the average or Mean Opinion Score (MOS) for each audio file is calculated. In order to achieve a reliable result for an ACR Test, a large pool of test subjects should be used (16 or more), and the test should be conducted under controlled conditions using a quiet environment. Generally, scores become more stable as the number of listeners increases. In order to reduce the variability in scores and to help with scaling of results, tests commonly include reference files that have "industry accepted" MOS scores.
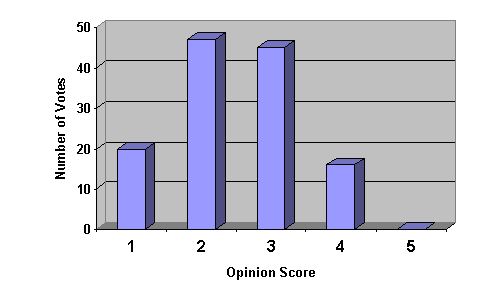
The chart below (Figure 1) shows the raw votes from an actual ACR Test with 16 listener votes that resulted in a MOS score of 2.4. The high number of votes for opinion scores “2” and “3” are consistent with the MOS score of 2.4; however, a significant number of listeners did vote scores of “1” and “4.”
Figure 1: Chart Showing Listener Votes For an Actual ACR Test

When conducting a subjective test, it is important to understand that the test is truly “subjective,” and that the test results can vary considerably. Within the telephony industry, manufacturers often quote MOS scores associated with CODECs; in reality, these scores are a value selected from a given subjective test.
Test labs typically use high quality audio recordings of phonetically balanced source text, such as the Harvard Sentences, for input to the VoIP system being tested. The Harvard Sentences are a set of English phrases chosen so that the spoken text will contain the range of sounds typically found in speech. Recordings are obtained in quiet conditions using high-resolution (16 bit) digital recording systems and are adjusted to standardized signal levels and spectral characteristics. The International Telecommunications Union (ITU) and the Open Speech Repository are sources of phonetically balanced speech material.
In addition to ACR, other types of subjective tests include the Degradation Category Rating (DCR) and Comparison Category Rating (CCR). DCR methodology looks at the level of degradation for the impaired files and produces a DMOS score. The Comparison Category Rating (CCR) Test compares pairs of files and produces a CMOS score.
In order to differentiate between listening and conversational scores, the International Telecommunication Union (ITU) introduced the terms MOS-Listening Quality (MOS-LQ) and MOS-Conversational Quality (MOS-CQ) with the additional suffixes (S)ubjective, (O)bjective and (E)stimated. Hence, a listening quality score from an ACR test is a MOS-LQS.
Conversational Quality Testing
Conversational quality testing is more complex, and hence, used much less frequently. In a conversational test, a pool of listeners are typically placed into interactive communication scenarios and asked to complete a task over a telephone or VoIP system. Testers introduce effects such as delay and echo, and the test subjects are asked for their opinion on the quality of the connection.
The effect of delay on conversational quality is very task dependant. For non-interactive tasks, one-way delays of several hundred milliseconds can be tolerated; for highly interactive tasks, even short delays can introduce conversational difficulty.
The task dependency of delay introduces some question over the interpretation of conversational call quality metrics. For example, two identical VoIP system connections have 300 milliseconds of one-way delay; however, one supports a highly interactive business negotiation, while the other supports an informal chat between friends. In the first example, users may say that call quality was bad: in the second case, the users probably would not even notice the delay.
Sample-Based Objective Testing
In an effort to supplement subjective listening quality testing with lower cost objective methods, the ITU developed P.861 (PSQM) and the newer P.862. These measurement techniques determine the distortion introduced by a transmission system or CODEC by comparing an original reference file sent into the system with the impaired signal that came out. Although these techniques were developed for lab testing of CODECs, they are widely used for VoIP network testing.
The P.861 and P.862 algorithms divide the reference and impaired signals into short overlapping blocks of samples, calculate Fourier Transform coefficients for each block and compare the sets of coefficients. P.862 produces a PESQ score that has a similar range to MOS; however, it is not an exact mapping. The new PESQ-LQ score is more closely aligned with listening quality MOS. These algorithms both require access to both the source file and the output file in order to measure the relative distortion.
In 2004, the ITU standardized P.563, a single-ended objective measurement algorithm that is able to operate on the received audio stream only. The MOS scores produced by P.563 are more widely spread that those produced by P.862, and it is necessary to average the results of multiple tests in order to achieve a stable quality metric. This approach is not suited for measuring individual calls but can produce reliable results when used over many calls to measure service quality.
As this type of algorithm requires significant computation for every sample, i.e., processing for each of 8,000 samples per second for narrowband voice and 16,000 samples per second for wideband voice, the processing load (of the order of 100 MIPS per call stream) and memory requirements are quite significant. For many applications this is impractical; in which case, packet-based approaches should be used.
The E Model and VQmon
VQmon is an efficient VoIP call quality-- monitoring technology based on the E Model-- it's able to obtain call quality scores using typically less than one thousandth of the processing power needed by the P.861/862/563 approaches. The E Model was originally developed within the European Telecommunications Standardization Institute (ETSI) as a transmission planning tool for telecommunication networks; however, it is widely used for VoIP service quality measurement.
Based on several earlier opinion models, the E Model (described in ETSI technical report ETR 250) has a lengthy history. The E Model was standardized by the ITU as Recommendation G.107 in 1998 and is being updated and revised annually. Some extensions to the E Model that enable it's use in VoIP service quality monitoring were developed by Telchemy, Inc., and have been standardized in ETSI TS 101 329-5 Annex E.
The objective of the E Model is to determine a transmission quality rating, i.e., the “R” factor that incorporates the “mouth to ear” characteristics of a speech path. The range of the R factor is nominally 0-120. The typical range for R factors is 50-94 for narrowband telephony and 50-110 for wideband telephony. The R Factor can be converted to estimated conversational and listening quality MOS scores (MOS-CQ and MOS-LQ).
The E Model is based on the premise that the effects of impairments are additive. The basic E Model equation is:
R = Ro - Is - Id - Ie + A
Where:
“Ro” is a base factor determined from noise levels, loudness, etc.
“Is” represents signal impairments occurring simultaneously with speech, including: loudness, quantization (CODEC) distortion and non-optimum sidetone level
“Id” represents impairments that are delayed with respect to speech, including echo and conversational difficulty due to delay
“Ie” is the ‘equipment impairment factor’ and represents the effects of VoIP systems on transmission signals.
“A” is the ‘advantage factor’ and represents the user’s expectation of quality when making a phone call. For example, a mobile phone is convenient to use; hence, people are more forgiving on quality-related problems.
VQmon is an extended version of the E Model that incorporates the effects of time varying IP network impairments and provides a more accurate estimate of user opinion. VQmon also incorporates extensions to support Wideband codecs.
Comparing Voice Quality Metrics
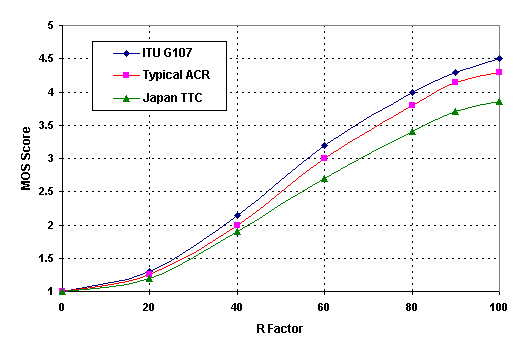
Figure 2: Chart Showing the Relationship Between the R factor and MOS Score

The chart above (Figure 2) shows the relationship between the R factor generated by the E Model and MOS. The "official" mapping function provided in ITU G.107 gives a MOS score of 4.4 for an R factor of 93 (corresponding to a typical unimpaired G.711 connection, i.e., the equivalent of a regular telephone connection).
Recent ACR subjective test data suggests that a MOS score of 4.1 to 4.2 would be more appropriate for unimpaired G.711.
This would provide a slightly different mapping for "Typical ACR" than shown in the graph above.
In Japan, the TTC committee developed an R factor to MOS mapping methodology that provides a closer match based on the results of subjective tests conducted in Japan. The TTC scores are traditionally lower than those in the US and Europe due in some part to cultural perceptions of quality and voice transmission.
Therefore, the chart above shows three potential mappings from R to MOS:
- ITU G.107 mapping
- ACR mapping
- Japanese TTC mapping.
Another complication is introduced when wideband CODECs are used. An ACR test is on a fixed 1-5 scale, and is really a test that is relative to some reference conditions. In a wideband test the same scale is used, hence a wideband CODEC may have a MOS score of 3.9 even though it sounds much better than a narrowband CODEC with a MOS of 4.1. This is not the case for R factors, which have a scale that encompasses both narrowband and wideband. Therefore a wideband CODEC may result in an R factor of 105 whereas a typical narrowband CODEC may result in an R factor of 93.
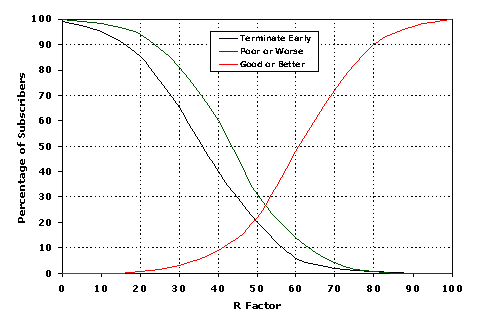
Figure 3: Chart Showing the Relationship Between R factor and Subscriber Opinion

The chart above (Figure 3) shows the relationship between R Factor and the percentage of subscribers, i.e., users, that would typically regard the call as being Good or Better (GoB), Poor or Worse (PoW) or Terminate the Call Early (TME). For example at an R Factor of 60, over 40% of subscribers would regard the call quality as "good;” Nearly 20% of subscribers would regard the call quality "poor." And, almost 10% would terminate the call early.
Acceptable Voice Quality Levels
The table below (Figure 4) shows a typical representation of call quality levels.
Figure 4: Typical Representation of Call Quality Levels
User Opinion |
R Factor |
MOS
(ITU scale) |
MOS
(ACR scale) |
Maximum Obtainable For G.711 |
93 |
4.4 |
4.1 |
Very Satisfied |
90 – 100 |
4.3 – 5.0 |
4.1 – 5.0 |
Satisfied |
80 – 90 |
4.0 – 4.3 |
3.7 – 4.1 |
Some Users Satisfied |
70 – 80 |
3.6 – 4.0 |
3.4 – 3.7 |
Many Users Dissatisfied |
60 – 70 |
3.1 – 3.6 |
2.9 – 3.4 |
Nearly All Users Dissatisfied |
50 – 60 |
2.6 – 3.1 |
2.4 – 2.9 |
Not Recommended |
0 – 50 |
1.0 – 2.6 |
1.0 – 2.4 |
Generally, an R Factor of 80 or above represents a good objective however there are some key things to note:
Since R Factors are conversational metrics, the statement that R Factors should be 80 or more implies both a good listening quality and low delay. Stating that (ITU scaled) MOS should be 4.0 or better is not the same as assuming that this is MOS-LQ and does not incorporate delay. Saying that R should be 80 or more and MOS should be 4.0 or more is not consistent. Telchemy introduced the notation R-LQ and R-CQ to deal with this; hence, an R-LQ of 80 would be comparable with a MOS of 4.0.
The typically manufacturer-quoted MOS for G.729A is 3.9 implying that G.729A could not meet the ITU scaled MOS for “Satisfied.” However G.729A is widely used and appears to be quite acceptable/ this problem is due to the scaling of MOS and not the CODEC. Typical ACR scores for CODECs should be compared to an ACR scaled range. For example, “Satisfied,” would range 3.7 to 4.1 and hence the G.729A MOS of 3.9 would be within the Satisfied range.
Summary
When specifying call quality objectives, it is important to be clear about terminology -- either specify R Factor (R-CQ) or MOS-CQ or the combination of MOS-LQ and delay. If you using wideband and narrowband CODECs then be aware that you need to interpret MOS scores as "narrowband MOS" or "wideband MOS" in order to avoid confusion.
References
[1] ETSI TS 101 329-5 QoS Measurement for VoIP
[2] ITU-T G.107 The E Model: A computational
model for use in planning
[3] ITU-T SG12 Contribution D103, Proposed
clarification to “MOS” terminology, January 2003
[4] ITU-T SG12 Contribution D105, VQmon
Description, January 2003
[5] ITU-T Recommendation P.862 Perceptual Estimation of Speech Quality (PESQ)
Acronyms
"R" Factor -- Transmission Quality Rating
ACR -- Absolute Category Rating (Test)
CCR --Comparison Category Rating (Test)
CMOS -- Comparision Mean Opinion Score
DCR -- Degradation Category Rating (Test)
DMOS -- Degradation Mean Opinion Score
ETSI -- European Telecommunications Standardization Institute
GoB -- Good or Better (Score)
IETF -- Internet Engineering Task Force
IP -- Internet Protocol
ITU -- International Telecommunications Union
MOS -- Mean Opinion Score
MOS-CQ -- Mean Opinion Score - Conversational Quality
MOS-LQ -- Mean Opinion Score - Listening Quality
Perceptual Speech Quality Measurement
PESQ -- Perceptual Evaluation of Speech Quality
PoW -- Poor or Worse (Score)
TME -- Terminate the Call Early (Score)
TTC -- Telecommunications Technology Committee
VoIP -- Voice over Internet Protocol
Alan Clark Ph.D., TMCnet VoIP Performance Management Columnist, founded Telchemy Incorporated in August 1999. Prior to Telchemy, Clark was the Chief Technical Officer at Hayes Corporation and played a key role in establishing industry-wide voice/data integration standards.
Dr. Clark is the inventor of the V.42bis data compression algorithm and the architect and editor of the V.58 network management standard. Published widely, he has nine granted and five patents pending and is recognized as a major authority in QoS and Packet Voice research and development.
Telchemy, Incorporated is the global leader in real-time VoIP Fault and Performance Management with its VQmon and SQmon families of call quality monitoring and analysis software. Telchemy is the world's first technology company to provide voice quality management tools that consider the effects of time-varying network impairments and the perceptual effects of time-varying call quality.
|