Q: I am looking for models to
calculate the total cost of an agent. I am also looking for current
information on cost per call and per minute. Any suggestions?
-- Jay Allen
A: There are several ways to
look at the total cost of an agent. The TOTAL cost of an agent is computed
by dividing the total cost of operating the contact center by the number of
full-time equivalent agents. The costs of operating the contact center
should include salaries and benefits for all employees in the center;
recruiting, hiring and training costs; facilities costs (rent, utilities,
etc.); technology costs (hardware, software and maintenance); outsourcing
costs; and corporate overhead. Using this calculation, a cost per agent
ranging from $75,000 to $100,000 is not uncommon. Since a great many of
these costs are fixed and do not vary as the agent size increases or
decreases, managers often look at the VARIABLE cost of an agent defined as
their salary plus benefits plus the costs to recruit, hire and train the
agent. The variable cost per agent ranges from $35,000 to $60,000. The
average cost per inbound call in the Purdue University database is $7.00.
Estimates of the average cost per inbound call handling minute range from
$.60 to over $1.00.
Call Center Reporting Information
In a recent BenchmarkPortal One-Minute Survey, we investigated the effort
and satisfaction involved with creating call center reports. The graph below
shows the results of the first three questions of the survey:
'How many FTE hours per week are spent preparing reports for your call
center?'
'How many separate sources of data are used for your reports?'
'Once the report is ready, how 'old' is the information (in hours)?'
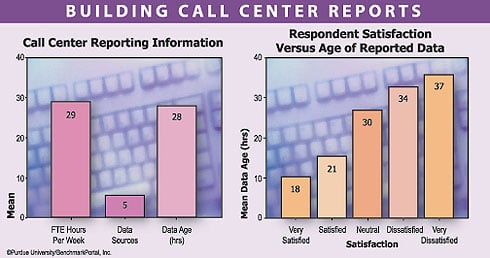
As you can see, creating reports for a call center is basically a
full-time responsibility. It's also interesting to note how many separate
sources of data are included in the reports for a call center. Given the
critical nature of some of the information that must appear in these call
center reports, we decided to investigate how satisfied the respondents were
with the resulting reports. We discovered that the respondents'
satisfaction with the reports was directly related to the age of the data
represented, as is seen in the graph.
Respondent Satisfaction Versus Age Of Reported Data
Digging a little deeper, we can determine statistically that the data age
that would most probably result in a 'very satisfied' response would be
between 10 and 15 hours old. From our overall satisfaction question, only 14
percent of the respondents were 'very satisfied,' which implies there is
room for improvement in call center reporting.
The following shows the most popular reporting tools in use by our
respondents.
| Product |
Respondents
Who Use It |
| Excel |
18% |
| Crystal Reports |
17% |
| Access |
13% |
| CMS |
6% |
| CenterVu |
6% |
| Avaya |
3% |
Dr. Jon Anton (also known as 'Dr. Jon') is the
Director of Benchmark Research at Purdue University Center for
Customer-Driven Quality. Have a question? E-mail him at [email protected].
[ Return To The
September 2002 Table Of Contents ]
|
 TMCnet LOGIN