| [February 15, 2017] |
 |
Function(x) Inc. Reports Second Quarter Financial Results
Function(x) Inc. (NASDAQ:FNCX) (the "Company") yesterday reported
financial results for the three and six months ended December 31, 2016.
This Smart News Release features multimedia. View the full release here:
http://www.businesswire.com/news/home/20170215005549/en/
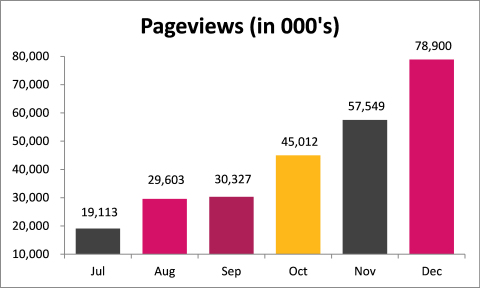
Function(X), Inc. - Key Performance Indicators (Publishing Segment)
Revenue for the three months ended December 31, 2016 was $1,215,000,
down from $1,782,000 for the three months ended December 31, 2015. For
the three months ended December 31, 2016, revenue for the Company's
Publishing Segment, which we consider our core operating business, was
$834,000, up 57.4% from $530,000 for the three months ended December 31,
2015. Additionally, this represents a 125% increase above the $371,000
in Publishing Segment revenue posted last quarter.
Net loss and diluted loss per share for the three-month period ended
December 31, 2016 were $(2,771,000) and $(1.13), respectively. The same
metrics for the six-month period ended December 31, 2016 were
$(10,324,000) and $(3.64), respectively.
EBITDA for the Company for the three months ended December 31, 2016 was
a loss of $(1,621,000), which is an improvement from a loss of
$(37,748,000) for the same period in 2015. The three months ended
December 31, 2015 includes significant non-cash impairment charge of
$30,402,000 that is included in the EBITDA calculation. EBITDA for the
Publishing Segment was a loss of $(1,105,000) for the three months ended
December 31, 2016, which represents an improvement from the loss of
$(28,493,000) for such segment for the three months ended December 31,
2015. The three months ended December 31, 2015 EBITDA figures for the
Publishing Segment include $26,977,000 of non-cash impairment expense.
This quarter's EBITDA in the publishing segment represents a $1,824,000
improvement over the prior quarter's results.
For full details on the above and other pertinent figures, please see
exhibit A and B, attached hereto.
"The continued dramatic improvement in operating results, fueled by
impressive growth in user engagement metrics, confirms that the plan we
instituted at the beginning of this fiscal year is hitting on all
cylinders," said Robert FX Sillerman, Executive Chairman and Chief
Executive Officer. "This growth is continuing, and we expect to magnify
these results when we shift our focus to the Rant brand. Over the past
six months, we have focused our efforts on growing Wetpaint user
engagement and monetization; focus which has proven successful at
Wetpaint. Applying this same methodology to Rant, and in the future to
additional sites, should continue to grow and strengthen our publishing
business."
"I am confident that the recent successes of the business are just the
beginning of what will be a very exciting period. I look forward to
building upon this strong performance and coming up with new and
innovative ways to make this the business all that we know it can be, a
creative and innovative digital platform that is rivaled by none," said
Brian Rosin, COO.
Our Q2 Fiscal 2017 accomplishments listed below continue to be guided by
our overall strategy and vision, in which Function (x) is building a
highly scalable publishing platform that is designed to efficiently
create, share and monetize content across a wide range of topics and
audiences. Our property, Wetpaint, has begun to take full advantage of
our publishing infrastructure to deliver compelling content around pop
culture and entertainment, as demonstrated by the increase in engagement
and revenue. We plan on duplicating this success by focusing on the Rant
properties, applying our effective monetization strategy to further
increase revenues.
Fiscal 2017 Second Quarter Highlights and Recent Developments
-
Brian Rosin, COO: On January 19, 2017, the Company named Brian
Rosin as its Chief Operating Officer. In this role, Mr. Rosin will
report directly to Mr. Sillerman and will be responsible for driving
the long-term strategy and vision of the Company as well as overseeing
all day-to-day operations.
-
Non-Core Assets: We are negotiating the sale of a majority
stake in our non-core assets principally in the technology space,
including certain intellectual property related to Social Distribution
System ("SDS") and the assets related to the DraftDay daily fantasy
sports business. If completed, the contemplated transaction would
combine these assets in to a new company, Element(X). In addition, the
Company intends to enter into a shared services agreement with
Element(X), which will provide for a monthly payment for legal,
accounting and office-related expenses, among other things. The terms
of any such transaction will be determined on an arms-length basis and
will only be consummated if the board of directors determines that the
transaction is in our best interests as a Company. There can be no
assurance that we will be successful in consummating such a
transaction on the terms as described, or at all.
-
Deleveraging Initiatives: Affiliates of Function(x)'s Chairman
and CEO, Mr. Sillerman, have committed to converting approximately
$36,000,000 in preferred equity into shares of the Company's common
stock.
-
Built upon foundation for future growth: Continued to refine
our streamlined headcount plan to scale the business, disciplined
financial controls and operating expense model and revamp its
technology platform and acquisition team intended to drive incremental
growth.
-
Optimized Revenue Model: Our Revenue Model has shown that it
has the ability to drive growth in our Wetpaint property, success that
we plan to replicate across other properties.
-
Key performance metrics: Through our daily monitoring of user
engagement metrics, we are able to react quickly to market trends and
adjust strategy, which has been a key component in our recent growth.
This automated reporting and analytics allow for continuous refinement
to our approach to implementing the long-term strategy.
About Function(x) Inc.
Function(x) operates Wetpaint.com
and Rant. Wetpaint is the leading online destination for entertainment
news for millennial women, covering the latest in television, music, and
pop culture. Rant is a leading digital publisher with original content
in multiple different verticals, most notably in sports, entertainment,
and pets. Function(x) Inc. is also the largest shareholder
of DraftDay Gaming Group, which is well-positioned to become a
significant participant in the expanding fantasy sports market, offering
a high-quality daily fantasy sports experience both directly to
consumers and to businesses desiring turnkey solutions to new revenue
streams. Function(x) Inc. also owns Choose Digital, a digital
marketplace platform that allows companies to incorporate digital
content into existing rewards and loyalty programs in support of
marketing and sales initiatives. For more information, visit www.functionxinc.com.
Forward-Looking Statements
This press release may contain forward-looking statements within the
meaning of Section 27A of the Securities Act of 1933, as amended, and
Section 21E of the Securities Exchange Act of 1934, as amended, and as
defined in the U.S. Private Securities Litigation Reform Act of 1995.
These forward-looking statements involve inherent risks and
uncertainties that could cause actual results to differ materially from
those projected or anticipated. All information provided in this press
release is as of the date of this release. Except as required by
law, Function(x), Inc. undertakes no obligation to update or revise
publicly any forward-looking statements, whether as a result of new
information, future events or otherwise, after the date on which the
statements are made or to reflect the occurrence of unanticipated events.
Definitions
The following definitions apply to these terms as used throughout this
press release and the exhibits:
Publishing Segments - represents Wetpaint and Rant and any corporate
expenses allocated to this segment.
EBITDA - represents net income (loss) before other income (loss),
interest expense, income taxes, depreciation and amortization.
Non-GAAP Financial Measures
We prepare our financial statements in accordance with generally
accepted accounting principles ("GAAP") in the United States of America.
Within this press release, we make reference to EBITDA, which is a
non-GAAP financial measure. We include these non-GAAP financial measures
because management believes they are useful to investors in that they
provide for greater transparency with respect to supplemental
information used by management in its financial and operational decision
making.
Management uses EBITDA to convey supplemental information to investors
regarding our performance excluding the impact of certain non-cash
charges, costs associated with our borrowings and other special items
that can affect the comparability of results from quarter to quarter. In
particular, EBITDA is a key measure used by our management and board of
directors to understand and evaluate our core operating performance and
trends, to prepare and approve our annual budget, and to develop short-
and long-term operational plans. Of note, the elimination of certain
expenses in calculating EBITDA can provide a useful measure for
period-to-period comparisons of our core business.
Accordingly, we believe the presentation of these non-GAAP financial
measures, when used in conjunction with GAAP financial measures, is a
useful financial analysis tool that can assist investors in assessing
our operating performance and underlying prospects. This analysis should
not be considered in isolation or as a substitute for analysis of our
results as reported under GAAP. This analysis, as well as the other
information in this press release, should be read in conjunction with
our consolidated financial statements and footnotes contained in the
Form 10-Q that we filed with the U.S. Securities and Exchange
Commission. The non-GAAP financial measures used in this press release
may be different from the methods used by other companies. For more
information on the Non-GAAP financial measures, please see the
Reconciliation of GAAP financial measures to Non-GAAP financial measures
table in the press release.
|
|
|
Three Months Ended December 31st
|
|
|
2016
|
|
|
2015
|
|
|
|
|
|
|
|
|
|
|
Publishing Segment Revenue Reconciliation
|
|
|
Publishing Segment Revenue Reconciliation
|
|
|
GAAP Revenue
|
$1,215
|
|
|
GAAP Revenue
|
$1,782
|
|
|
- DDGG Revenue
|
$256
|
|
|
- Choose Revenue
|
$885
|
|
|
- Corporate Revenue
|
$125
|
|
|
- DDGG Revenue
|
$243
|
|
|
Publishing Segment Revenue
|
$834
|
|
|
- Corporate Revenue
|
$125
|
|
|
|
|
|
|
Publishing Segment Revenue
|
$530
|
|
|
|
|
|
|
|
|
|
|
|
|
|
|
|
|
|
|
|
|
|
|
|
|
|
|
Company EBITDA Reconciliation
|
|
|
|
Company EBITDA Reconciliation
|
|
|
|
GAAP Net Loss
|
($2,771)
|
|
|
GAAP Net Loss
|
($39,570)
|
|
|
+ Interest Expenses
|
$2,471
|
|
|
+ Interest Expenses
|
$926
|
|
|
+ Depreciation and Amortization
|
$738
|
|
|
+ Depreciation and Amortization
|
$898
|
|
|
+ Other (income)/expense, net
|
($2,161)
|
|
|
+ Other (income)/expense, net
|
($1)
|
|
|
+ Taxes
|
$102
|
|
|
EBITDA
|
($37,747)
|
|
|
EBITDA
|
($1,621)
|
|
|
|
|
|
|
|
|
|
|
|
|
|
|
|
|
|
|
|
|
|
|
|
|
|
|
|
|
|
|
Publishing Segment EBITDA Reconciliation
|
|
|
Publishing Segment EBITDA Reconciliation
|
|
|
GAAP Net Loss
|
($2,770)
|
|
|
GAAP Net Loss
|
($39,571)
|
|
|
- Choose Net Loss
|
($47)
|
|
|
- Choose Net Loss
|
($3,645)
|
|
|
- DDGG Net Loss
|
($715)
|
|
|
- DDGG Net Loss
|
($1,533)
|
|
|
+ Interest Expenses
|
$2,471
|
|
|
- MyGuy Net Loss
|
($214)
|
|
|
+ Depreciation and Amortization
|
$491
|
|
|
- Corporate Net Loss
|
($4,125)
|
|
|
+ Other (income)/expense, net
|
($2,161)
|
|
|
+ Interest Expenses
|
$926
|
|
|
+ Taxes
|
$102
|
|
|
+ Depreciation and Amortization
|
$636
|
|
|
EBITDA
|
($1,105)
|
|
|
+ Other (income)/expense, net
|
($1)
|
|
|
|
|
|
|
EBITDA
|
($28,493)
|
|
* Numbers may not total due to rounding
|
|
|
|
|
|
|
|
|
|
|
|
|
|
|
|
Six Months Ended December 31st
|
|
|
2016
|
|
|
2015
|
|
|
|
|
|
|
|
|
|
|
Publishing Segment Revenue Reconciliation
|
|
|
Publishing Segment Revenue Reconciliation
|
|
|
GAAP Revenue
|
$1,875
|
|
|
GAAP Revenue
|
$3,255
|
|
|
- Choose Revenue
|
$58
|
|
|
- Choose Revenue
|
1,634
|
|
|
- DDGG Revenue
|
$361
|
|
|
- DDGG Revenue
|
326
|
|
|
- Corporate Revenue
|
$250
|
|
|
- Corporate Revenue
|
250
|
|
|
Publishing Segment Revenue
|
$1,205
|
|
|
Publishing Segment Revenue
|
$1,045
|
|
|
|
|
|
|
|
|
|
|
|
|
|
|
|
|
|
|
|
|
|
|
|
|
|
|
Company EBITDA Reconciliation
|
|
|
|
Company EBITDA Reconciliation
|
|
|
|
GAAP Net Loss
|
($10,324)
|
|
|
GAAP Net Loss
|
($48,336)
|
|
|
+ Interest Expenses
|
$4,121
|
|
|
+ Interest Expenses
|
$1,783
|
|
|
+ Depreciation and Amortization
|
$1,425
|
|
|
+ Depreciation and Amortization
|
$1,846
|
|
|
+ Other (income)/expense, net
|
$325
|
|
|
+ Other (income)/expense, net
|
($3)
|
|
|
+ Taxes
|
$102
|
|
|
EBITDA
|
($44,710)
|
|
|
EBITDA
|
($4,351)
|
|
|
|
|
|
|
|
|
|
|
|
|
|
|
|
|
|
|
|
|
|
|
|
|
|
|
|
|
|
|
Publishing Segment EBITDA Reconciliation
|
|
|
Publishing Segment EBITDA Reconciliation
|
|
|
GAAP Net Loss
|
($10,324)
|
|
|
GAAP Net Loss
|
($48,336)
|
|
|
- Choose Net Loss
|
($448)
|
|
|
- Choose Net Loss
|
($4,120)
|
|
|
- DDGG Net Loss
|
($1,467)
|
|
|
- DDGG Net Loss
|
($1,507)
|
|
|
+ Interest Expenses
|
$4,121
|
|
|
- MyGuy Net Loss
|
($550)
|
|
|
+ Depreciation and Amortization
|
$932
|
|
|
- Corporate Net Loss
|
($8,250)
|
|
|
+ Other (income)/expense, net
|
$325
|
|
|
+ Interest Expenses
|
$620
|
|
|
+ Taxes
|
$102
|
|
|
+ Depreciation and Amortization
|
$1,274
|
|
|
EBITDA
|
($2,929)
|
|
|
+ Other (income)/expense, net
|
($3)
|
|
|
|
|
|
|
EBITDA
|
($32,016)
|
|
* Numbers may not total due to rounding
|
|
|
|
|
|
|
|
|
|
|
|
|
|
|
|
|
|
|
|
|
Function(x) Inc.
|
|
|
CONSOLIDATED BALANCE SHEETS
|
|
|
(amounts in thousands, except share data)
|
|
|
|
|
|
|
|
|
|
|
December 31, 2016 (Unaudited)
|
June 30, 2016
|
|
|
Assets
|
|
|
|
|
|
|
Current assets:
|
|
|
|
|
|
|
Cash and cash equivalents
|
$
|
122
|
|
|
$
|
537
|
|
|
Marketable securities
|
|
-
|
|
|
|
2,495
|
|
|
Accounts receivable (net of allowance for doubtful accounts of $20
at December 31, 2016 and June 30, 2016)
|
|
742
|
|
|
|
307
|
|
|
Prepaid expenses
|
|
72
|
|
|
|
226
|
|
|
Other receivables
|
|
50
|
|
|
|
114
|
|
|
Other current assets
|
|
179
|
|
|
|
110
|
|
|
Current assets of discontinued operations
|
|
20
|
|
|
|
39
|
|
|
Total current assets
|
|
1,185
|
|
|
|
3,828
|
|
|
Restricted cash
|
|
498
|
|
|
|
440
|
|
|
Property & equipment, net
|
|
1,260
|
|
|
|
1,414
|
|
|
Intangible assets, net
|
|
9,573
|
|
|
|
5,339
|
|
|
Goodwill
|
|
18,859
|
|
|
|
11,270
|
|
|
Other assets
|
|
432
|
|
|
|
748
|
|
|
Total assets
|
$
|
31,807
|
|
|
$
|
23,039
|
|
|
|
|
|
|
|
|
|
Liabilities, convertible redeemable preferred stock and
stockholders' equity/(deficit)
|
|
|
|
|
|
Current liabilities:
|
|
|
|
|
|
|
Accounts payable and accrued expenses
|
$
|
8,901
|
|
|
$
|
11,625
|
|
|
Deferred revenue
|
|
682
|
|
|
|
637
|
|
|
Current portion of loans payable and conversion feature, net
|
|
10,794
|
|
|
|
8,996
|
|
|
Current liabilities of discontinued operations
|
|
2,703
|
|
|
|
2,851
|
|
|
Total current liabilities
|
|
23,080
|
|
|
|
24,109
|
|
|
Loans payable, less current portion
|
|
-
|
|
|
|
19,716
|
|
|
Deferred revenue
|
|
3,446
|
|
|
|
3,429
|
|
|
Deferred tax liability
|
|
102
|
|
|
|
-
|
|
|
Common stock warrant liability
|
|
420
|
|
|
|
10
|
|
|
Other long-term liabilities
|
|
901
|
|
|
|
951
|
|
|
Total liabilities
|
|
27,949
|
|
|
|
48,215
|
|
|
|
|
|
|
|
|
|
Series A Convertible Redeemable Preferred Stock, $1,000 stated
value, authorized 100,000 shares, issued and outstanding -0- shares
as of December 31, 2016 and June 30, 2016
|
|
-
|
|
|
|
-
|
|
|
|
|
|
|
|
|
|
Commitments and contingencies
|
|
|
|
|
|
|
|
|
|
|
|
|
|
Stockholders' equity/(deficit):
|
|
|
|
|
|
|
Series B Convertible Preferred Stock, $1,000 stated value,
authorized 50,000 shares, issued and outstanding -0- shares as of
December 31, 2016 and June 30, 2016
|
|
-
|
|
|
|
-
|
|
|
Series C Convertible Redeemable Preferred Stock, $1,000 stated
value, authorized 100,000 shares, issued and outstanding of 33,175
and 3,000 shares as of December 31, 2016 and June 30, 2016,
respectively
|
|
34,907
|
|
|
|
4,940
|
|
|
Series D Preferred Stock, $1,000 stated value, authorized 150
shares, issued and outstanding -0- shares as of December 31, 2016
and June 30, 2016
|
|
-
|
|
|
|
-
|
|
|
Series E Convertible Preferred Stock, $1,000 stated value,
authorized 10,000 shares, issued and outstanding 4,435 and -0-
shares as of December 31, 2016 and June 30, 2016, respectively
|
|
7,600
|
|
|
|
-
|
|
|
Common stock, $0.001 par value: authorized 300,000,000 shares,
issued and outstanding 3,244,275 and 3,023,753 shares as of December
31, 2016 and June 30, 2016, respectively
|
|
3
|
|
|
|
3
|
|
|
Additional paid-in-capital
|
|
411,075
|
|
|
|
409,765
|
|
|
Treasury stock, 10,758 shares at December 31, 2016 and June 30, 2016
|
|
(11,916
|
)
|
|
|
(11,916
|
)
|
|
Accumulated deficit
|
|
(438,280
|
)
|
|
|
(428,380
|
)
|
|
Accumulated other comprehensive income
|
|
-
|
|
|
|
(361
|
)
|
|
Non-controlling interest
|
|
469
|
|
|
|
773
|
|
|
Total stockholders' equity/(deficit)
|
|
3,858
|
|
|
|
(25,176
|
)
|
|
Total liabilities and stockholders' equity/(deficit)
|
$
|
31,807
|
|
|
$
|
23,039
|
|
|
|
|
|
|
|
|
|
|
|
|
|
|
|
|
|
|
|
|
|
|
Function(x) Inc.
|
|
|
CONSOLIDATED STATEMENTS OF OPERATIONS
|
|
|
(amounts in thousands, except share and per share data)
|
|
|
(Unaudited)
|
|
|
|
|
|
|
|
|
|
|
|
|
|
|
|
|
Three Months Ended December 31,
|
|
|
Six Months Ended December 31,
|
|
|
|
|
2016
|
|
|
|
2015
|
|
|
|
2016
|
|
|
|
2015
|
|
|
Revenues
|
$
|
1,215
|
|
|
$
|
1,782
|
|
|
$
|
1,875
|
|
|
$
|
3,255
|
|
|
Selling, general and administrative expenses
|
|
(3,574
|
)
|
|
|
(10,025
|
)
|
|
|
(7,614
|
)
|
|
|
(19,409
|
)
|
|
Impairment loss (see Note 3)
|
|
-
|
|
|
|
(30,402
|
)
|
|
|
-
|
|
|
|
(30,402
|
)
|
|
Operating loss
|
|
(2,359
|
)
|
|
|
(38,645
|
)
|
|
|
(5,739
|
)
|
|
|
(46,556
|
)
|
|
|
|
|
|
|
|
|
|
|
|
|
|
|
Other expense:
|
|
|
|
|
|
|
|
|
|
|
|
|
Other (expense)/income, net
|
|
2,161
|
|
|
|
1
|
|
|
|
(326
|
)
|
|
|
3
|
|
|
Interest expense, net
|
|
(2,471
|
)
|
|
|
(926
|
)
|
|
|
(4,121
|
)
|
|
|
(1,783
|
)
|
|
Total other expense
|
|
(310
|
)
|
|
|
(925
|
)
|
|
|
(4,447
|
)
|
|
|
(1,780
|
)
|
|
|
|
|
|
|
|
|
|
|
|
|
|
|
Net loss before provision for income taxes
|
|
(2,669
|
)
|
|
|
(39,570
|
)
|
|
|
(10,186
|
)
|
|
|
(48,336
|
)
|
|
|
|
|
|
|
|
|
|
|
|
|
|
|
Income tax expense
|
|
(102
|
)
|
|
|
-
|
|
|
|
(102
|
)
|
|
|
-
|
|
|
|
|
|
|
|
|
|
|
|
|
|
|
|
Net loss from continuing operations
|
$
|
(2,771
|
)
|
|
$
|
(39,570
|
)
|
|
$
|
(10,288
|
)
|
|
$
|
(48,336
|
)
|
|
|
|
|
|
|
|
|
|
|
|
|
|
|
Net loss from discontinued operations
|
|
-
|
|
|
|
(5,124
|
)
|
|
|
(36
|
)
|
|
|
(9,773
|
)
|
|
|
|
|
|
|
|
|
|
|
|
|
|
|
Net loss
|
|
(2,771
|
)
|
|
|
(44,694
|
)
|
|
|
(10,324
|
)
|
|
|
(58,109
|
)
|
|
|
|
|
|
|
|
|
|
|
|
|
|
|
Accretion of Convertible Redeemable Preferred Stock
|
|
22
|
|
|
|
74
|
|
|
|
44
|
|
|
|
148
|
|
|
|
|
|
|
|
|
|
|
|
|
|
|
|
Undeclared Series C Convertible Redeemable Preferred Stock Dividend
|
|
(1,017
|
)
|
|
|
(306
|
)
|
|
|
(1,511
|
)
|
|
|
(613
|
)
|
|
|
|
|
|
|
|
|
|
|
|
|
|
|
Add: Net loss attributable to non-controlling interest
|
|
141
|
|
|
|
522
|
|
|
|
424
|
|
|
|
689
|
|
|
|
|
|
|
|
|
|
|
|
|
|
|
|
Net loss attributable to Function(x) Inc. common stockholders
|
$
|
(3,625
|
)
|
|
$
|
(44,404
|
)
|
|
$
|
(11,367
|
)
|
|
$
|
(57,885
|
)
|
|
|
|
|
|
|
|
|
|
|
|
|
|
|
Net loss per common share - basic and diluted:
|
|
|
|
|
|
|
|
|
|
|
|
|
Continuing operations
|
$
|
(1.13
|
)
|
|
$
|
(28.25
|
)
|
|
$
|
(3.64
|
)
|
|
$
|
(37.21
|
)
|
|
Discontinued operations
|
$
|
-
|
|
|
$
|
(3.69
|
)
|
|
$
|
(0.01
|
)
|
|
$
|
(7.56
|
)
|
|
Net loss per share attributable to Function(x) Inc. common
stockholders - basic and diluted
|
$
|
(1.13
|
)
|
|
$
|
(31.94
|
)
|
|
$
|
(3.65
|
)
|
|
$
|
(44.77
|
)
|
|
|
|
|
|
|
|
|
|
|
|
|
|
|
Weighted average common shares outstanding - basic and diluted
|
|
3,196,136
|
|
|
|
1,390,204
|
|
|
|
3,113,010
|
|
|
|
1,292,838
|
|
|
|
|
|
|
|
|
|
|
|
|
|
|
|
|
|
|

View source version on businesswire.com: http://www.businesswire.com/news/home/20170215005549/en/
[ Back To TMCnet.com's Homepage ]
|
