Planning beyond the current fiscal year puts real pressure on finance teams. Spreadsheets age fast, formulas break quietly, and manual processes leave gaps that only show up months later. When market conditions change mid-cycle, those gaps turn into costly miscalculations.
The right forecasting tools close that distance by pairing historical trends with live data inputs. Organizations gain a steadier view of revenue, cost trajectories, and growth patterns over multiple years, making it far easier to allocate resources with confidence.
1. Consolidating Data From Multiple Sources
Finance departments typically gather figures from accounting systems, sales pipelines, payroll platforms, and operational reports. Stitching those together by hand invites version conflicts and broken references.
Automated forecasting platforms pull directly from each source on a fixed schedule, housing everything in one place. That single, verified dataset means projections start with accurate, current numbers rather than stale quarterly exports sitting in someone's inbox.
1.1 Reducing Manual Entry Errors
One misplaced row or copied cell in a spreadsheet can quietly skew a five-year outlook. A purpose-built platform catches those issues through validation rules applied right at the point of entry. Fields that fall outside expected ranges flag themselves before they contaminate downstream calculations.
Fewer corrections over time frees analysts to focus on reading the numbers rather than fixing them. Reliable budget forecasting software enables teams to construct multiple scenarios in parallel, each based on a distinct set of variables.
2. Scenario Modeling for Strategic Decisions
Any long-range plan rests on assumptions about pricing, staffing levels, and customer demand. An analyst can shift a single input, say raw material cost or churn rate, and trace the impact through every connected financial statement. That turns vague "what-if" conversations into side-by-side comparisons that a board or investor group can weigh concretely.
2.1 Stress-Testing Assumptions
Going beyond simple best-case and worst-case brackets, advanced platforms support probability-weighted distributions. Finance leaders assign likelihood scores to individual scenarios, then generate blended projections from those weights.
The output reveals which assumptions carry the greatest risk, pointing teams toward the variables that need closer attention across a three- to five-year planning window.
3. Rolling Forecasts Over Fixed Annual Budgets
A traditional annual budget freezes targets for twelve months. Rolling forecasts take a different approach, refreshing projections each month or quarter and extending the horizon by the same period.
That continuous refresh keeps estimates tethered to actual performance and emerging market signals. Teams catch problems in real time rather than discovering at year-end that a foundational assumption was off by a wide margin.
4. Improved Collaboration Across Departments
Finance rarely builds projections alone. Sales, operations, and human resources all carry assumptions that shape long-range numbers. Cloud-based forecasting platforms give each stakeholder controlled access to a shared model. Department heads enter their own estimates while finance reviews and reconciles inputs from a central view. That transparency cuts down on email chains and file version confusion that slow approval cycles.
4.1 Audit Trails and Accountability
Every adjustment logged inside the platform carries a timestamp and a user tag (News - Alert). If a projection shifts between board meetings, leadership can trace the change back to its origin. That kind of visibility strengthens confidence in the figures and shortens the review conversations that tend to stall decision-making.
5. Visualization That Highlights Trends Early
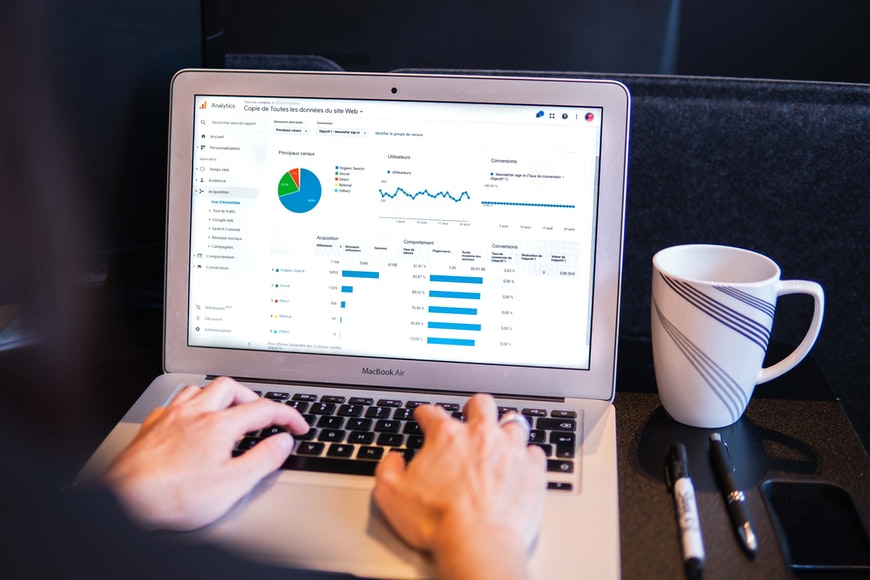
Thousands of rows in a raw table can bury an emerging pattern completely. Forecasting tools convert those outputs into dashboards, charts, and heat maps that surface shifts at a glance. A downward-curving revenue line in year three is immediately visible on the graph, prompting an earlier investigation.
Visual summaries also simplify communication with non-financial stakeholders, from board members to operational leads who need the takeaway without the granular detail.
6. Faster Re-Forecasting When Conditions Shift
Economic disruptions, regulatory updates, or supply chain shocks all call for rapid recalculation. Automated platforms refresh linked formulas across every sheet and scenario in minutes. A team that once spent two weeks restating a five-year plan can now deliver revised figures in a single afternoon. That speed matters because delayed responses leave organizations steering by assumptions that no longer reflect reality.
Conclusion
Sound long-term projections need more than experienced intuition. They depend on clean data, flexible scenario models, rolling timelines, and genuine cross-departmental transparency. Purpose-built forecasting platforms bring all those elements together in a single, connected, auditable environment.
Organizations that make the shift find themselves spotting risks earlier, acting on opportunities more quickly, and presenting stakeholders with figures grounded in traceable logic rather than optimistic guesswork.
